Hope everything is fine with all. Today i'm trying to post about something new, which will have certain value addition to a chemical engineers profile. The topic is related to statistical analysis and specifically about understanding the Process Capability & Performance Indices.
What does these mean ?
How to interpret these things ?
What actions can we make based on these indices ?
This is a query that i've received on my mail from one of a process engineer. Today here lets see how to calculate and understand these things in a process engineer's perspective and correlate them with our regular work.
Before going to the calculation part, lets understand the basic terminology.
What is capability ?
Capability is an ability to a certain task and the capability varies from task to task.
What is capability analysis ?
Analysing the capability of a specific process is nothing but capability analysis.
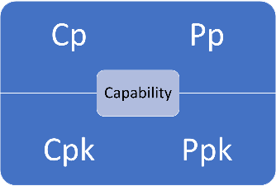
How can we classify capability ?
Capability shall be classified into two types i.e., Short term capability and Long term capability.
Short term capability shall be interpreted using the indices Cp & Cpk,
Long term capability shall be interpreted using the indices Pp & Ppk.
What does Cp / Pp indicate ?
Cp / Pp indicates Process potential index i.e., whether the data points can fit inside the specification limit that is laid by the customer or not.
What does Cpk / Ppk indicate ?
Cpk / Ppk indicates Centering index i.e., whether the data points were centrally located or not.
What is the differnece between Cp & Pp ?
Cp indicates the process potential based on the sample data, whereas the Pp indicates the same based on population data.
Similarly Cpk & Ppk indicates the centering index based on the sample data and population data.
If you still have confusion, all i can say is just remember the indices Cp & Cpk for analysing process capability when sample data is available and Pp & Ppk for analysisng the process capability when population data is available.
What is sample and population ?
Population is a collection of all data points related to a specific process, whereas sample is a set of data points which are picked from a population depending on specific methodology.
What are the various sampling methodologies ?
There are four basic sampling methodologies i.e.,
Random Sampling
Sequential Sampling
Stratified Sampling
Systematic Sampling
How to estimate / calculate the capability indices ?
We can use either manual calculations / Excel based calculations / Calculations using softwares like Minitab.
What are the formulae for manual calculation of these indices ?
Cp = (USL - LSL)/(6 x S)
Pp = (USL - LSL)/(6 x 𝜎)
Cpk = Min (Cpu, Cpl)
Cpu = (USL - x)/(3 x S); Cpl = (x - LSL)/(3 x S)
Ppk = Min (Ppu, Ppl)
Ppu = (USL - X)/(3 x 𝜎); Ppl = (X - LSL)/(3 x 𝜎)
where,
USL - Upper Specification Limit; LSL - Lower Specification Limit
S - Sample standard deviation; 𝜎 - Population Standard deviation
x - Sample mean; X - Population mean
Pro's & Con's of Long term & Short term capability analysis?
Analysing process capability using long term capability is difficult as we need to analyse huge data, whereas the analysis going to be accurate.
Analysing process capability using short term capability is easy as the data is set of sample points, but the results are not accurate as long term capability.
Lets try to calculate the above said indices with some random data, but before that we should see about the graphs used to represent data distribution and their interpretation using the indices.
Below is the normal distribution curve:
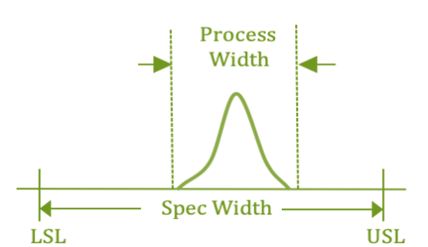
The above shown bell shaped curve indicates the distribution of data points related to a specific process and the process width indicates voice of process which is nothing but how the process delivers.
The graph shall be plotted with below steps:
i. Arrange the data points in ascending order
ii. Form certain classes for data i.e., if the specification limits are 70 - 120 Kg, then classes are going to be like 71 - 80, 81 - 90, 91 - 100, 101 - 110, 111 - 120.
iii. Now identify the number of data points (Frequency) that fall within these classes, for example there are 50 data points that we have collected and the total data points that falls within 71 - 80 is 5, 81 - 90 is 10, 91 - 100 is 15, 101 - 110 is 10 & 111 - 120 is 5.
iv. Plot a bar chart for classes on X - axis and frequency on Y - axis
v. Connect the center points of bars and it will form a bell shaped curve, just like below:

Here in the above plot, the bell shaped curve looks like having sharp edges which is due to the uniform data that i've considered. However, if the data is from real time, then the curve will take a different form.
Example:
Now, lets try to calculate the capability indices from a sample data which are the yields of a pharmaceutical product and the voice of customer is 70 - 120 Kg
Data: 80, 83, 97, 101, 104, 91, 72, 95, 111, 99, 89, 78, 107, 106, 90, 92, 99, 93, 80, 105, 95, 99, 100, 91, 85, 79, 81, 95, 95, 98, 92
Solution:
Voice of customer = Specification limits
Therefore, Upper specification limit = 120 & Lower specification limit = 80;
Here, we got only sample data, hence we need to estimate the Cp & Cpk,
If population data is available, then we need to estimate Pp & Ppk
Sample mean (x) = Average of data points = (Sum of all data points / No. of data points) = 92.97
Sample standard deviation (S) = Σ(xi - x)^2 / (n-1) = 9.62
Cp = (USL - LSL) / (6 x S) = (120 - 70) / (6 x 9.62) = 0.87
Cpk = Min(Cpu, Cpl)
Cpu = (USL - x) / (3 x S) = (120 - 92.97) / (3 x 9.62) = 0.94
Cpl = (x - LSL) / (3 x S) = (92.97 - 70) / (3 x 9.62) = 0.80
Therefore, Cpk = 0.80.
Now lets come to interpretation,
Process potential (Cp) itself is less than 1
that indicates process is not capable of delivering the output within the specification limits.
If Cp is between 1 and 1.33, process is capable, however there are few rejected batches,
If Cp is between 1.33 and 1.67, process is capable and reproducible,
If Cp is between 1.67 and 2, process is highly capable.
Now lets check the interpretation of Cpk,
In the above example, the Cp is less than 1, hence no need to discuss much about Cpk,
because if the data points are not within the specification limits, then automatically the points are not centered, hence no need to discuss about Cpk
If Cp is greater than, then we need to check the Cpk
Below is the representation of Cpk:
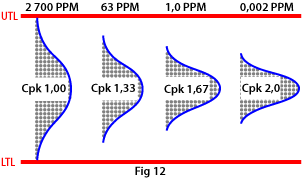
If Cpk = 1, the data points were spread across the specification limits and the centering is low
If Cpk = 1.33, the data points spread is reduced and the centering is increased,
If Cpk = 1.67, the centering is further increased
If Cpk = 2, the process is world class
Finally, i would like provide you a correlation between Cpk & Sigma level i.e.,
Sigma level = 3 x Cpk.
For Cpk = 2, Sigma level is 6, so its a Six Sigma process.
This is how, we need to calculate and interpret the process capability using capability indices.
Hope the post is clear to all...
For any queries, please write us at pharmacalc823@gmail.com
Comments are most appreciated.....!!!
Hi! I am Ajay Kumar Kalva, Currently serving as the CEO of this site, a tech geek by passion, and a chemical process engineer by profession, i'm interested in writing articles regarding technology, hacking and pharma technology.
Follow Me on Twitter AjaySpectator & Computer Innovations
Follow Me on Twitter AjaySpectator & Computer Innovations


 Hi! I am Ajay Kumar Kalva, owner of this site, a tech geek by passion, and a chemical process engineer by profession, i'm interested in writing articles regarding technology, hacking and pharma technology.
No comments:
Post a Comment